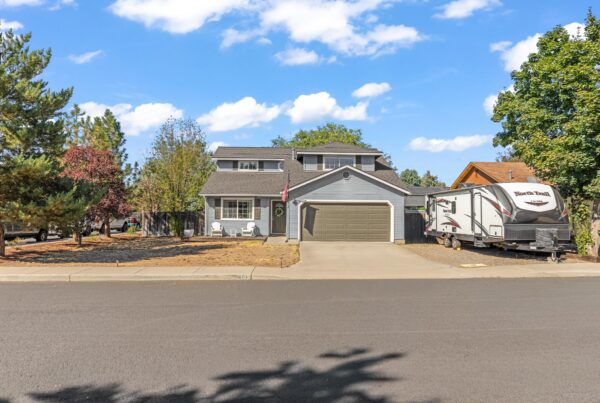

Pricing a home is not a contest to choose the highest possible number. It is a decision about where the property fits among the alternatives a buyer can purchase today—and how the price supports your timing, negotiating position and likely net proceeds.
A strong Bend pricing plan combines recent sales, current competition and the features that make the home meaningfully different. It also defines what evidence would justify holding the price or changing it after launch.
Start with the likely buyer pool
The most useful comparable properties are the ones a serious buyer would reasonably consider instead of yours. That group may be defined by neighborhood, price range, lot type, school boundary, age, condition, view, garage capacity, acreage or access to daily destinations. A fixed radius or a rigid number of days can exclude a better comparison and include a poor one.
Fannie Mae’s appraisal guidance similarly emphasizes comparable sales with similar physical and legal characteristics and allows older or competing-area sales when they are the best available evidence and the differences are explained. See its guidance on selecting comparable sales.
Build the pricing picture from more than closed sales
- Closed sales show what buyers and sellers actually agreed to and what lenders may later evaluate.
- Pending sales indicate which homes attracted an accepted offer, although the contract price may not be public yet.
- Active listings are the choices competing for attention now. Their asking prices are not proof of value.
- Expired or withdrawn listings can reveal where a property failed to connect with the market, but the reason may involve condition, access, marketing or seller decisions—not price alone.
Fannie Mae also directs appraisers to analyze closed sales, contract sales and current offerings when evaluating the market. That is a useful discipline for a seller even though a pre-listing analysis is not an appraisal. See the sales comparison guidance.
Compare the details buyers will notice
Two homes with similar square footage can compete very differently. A practical comparison should account for:
- lot usability, privacy, traffic and noise;
- condition, renovation quality and deferred maintenance;
- floor plan, bedroom placement and work-from-home flexibility;
- garage, shop, RV parking and storage;
- views, sun exposure and outdoor living;
- HOA obligations, utilities and ongoing ownership costs;
- property type, zoning and any material restrictions; and
- seller concessions, financing terms or personal property that affected a comparable sale.
Use Deschutes County DIAL to confirm public parcel, tax and recorded-property information. Public records are a starting point; they do not replace a site visit, title review or professional measurement when those details matter.
Choose the strategy before the listing goes live
The right list price depends partly on the seller’s priorities. A seller who needs a predictable closing date may choose differently from someone who can wait for a narrower buyer pool. Before launch, decide:
- the property’s most defensible value range;
- which competing listings buyers will compare directly;
- the preferred timing and minimum acceptable net proceeds;
- which repairs, credits or contract terms you are willing to consider; and
- what market response would trigger a review.
Online search brackets can affect visibility, but there is no universal rule that every property should be priced exactly at a round-number boundary. Review how the home appears in the actual price bands buyers are using without allowing a search filter to override the comparable evidence.
Read the market response in context
Showings, repeat visits, questions, written offers and buyer-agent feedback are useful signals. None should be interpreted alone. A quiet opening period may reflect price, presentation, seasonality, access restrictions, weather or the number of competing listings. Heavy traffic without offers can point to a mismatch between expectations and the home’s condition or terms.
Set a specific review date and compare the response with similar listings that launched at the same time. If competing homes are receiving offers while yours is not, revisit the price and presentation together. If the entire segment is quiet, a price change may not be the only answer.
Price changes should solve a defined problem
A small reduction that leaves the home in the same competitive position may not change buyer behavior. Before reducing, identify the new buyer pool or competing set the price is intended to reach. Then update the photography, showing notes or property information if those materials are contributing to the problem.
A change is easier to evaluate when it is tied to evidence rather than a blanket deadline. The goal is not to “chase the market”; it is to make a deliberate adjustment when new information shows that the original position is not working.
List price, appraisal and net proceeds are different numbers
The list price is a marketing and negotiation decision. An appraisal is an independent opinion prepared for a lender or client. The seller’s net is what remains after loan payoffs, agreed compensation, title and escrow charges, taxes, credits, repairs and other transaction-specific costs.
For a financed offer, the strongest price is not automatically the highest headline number. Financing, appraisal provisions, concessions, inspection terms, closing timing and the buyer’s ability to perform can all affect the risk-adjusted result.
Prepare the home and the pricing plan together
Pricing cannot completely compensate for unclear presentation or unresolved property questions. Review the Bend staging and showing guide and compare the tradeoffs in selling as-is versus pre-inspecting. A realistic preparation scope helps keep the pricing analysis focused on the home that will actually reach the market.
Get a property-specific Bend pricing analysis
A useful comparative market analysis should show the selected comparables, explain the adjustments and compare more than one pricing scenario. Bend Relo can prepare a seller net sheet alongside that analysis so the decision is tied to the outcome that matters. Start with a home valuation request or contact the team to discuss the property and timing.
Talk with David & the Bend Relo team
Buying, selling, relocating, or evaluating a specific property? Tell us what you are working through. We are happy to help.